e-statの境界データを使って人口数をプロットしてみる
e-Statから境界データ(小地域)を47県分ダウンロード(zipファイル)した後、geopandasのread_fileでshapefileを読込み、pandasのconcatで結合して全国のshapefileを作成する。
zipefileを使って一時フォルダにzipを展開
サンプル
import zipfile
import os

# zip展開
# DIR_DATAはダウンロードした47県分の境界データ(zipファイル)の保存場所
list_zip = os.listdir(DIR_DATA)
for file_name in list_zip:
    with zipfile.ZipFile(DIR_DATA + file_name) as myzip:
        myzip.extractall(TMP_DIR)
拡張子shpを読込み、1つのgeodataframeとして結合
サンプル
import geopandas as gpd
import pyproj
from fiona.crs import from_epsg
import pandas as pd

# shpファイル読込(もっと良い書き方がありそう)
# TMP_DIRはzipfile展開先のフォルダ
epsg_num = 4612
list_files = os.listdir(TMP_DIR)
cnt = 0
for x in list_files:
    # 拡張子を分離
    base, exe = os.path.splitext(x)
    if exe == ".shp":
        if cnt == 0:
            # Read file using gpd.read_file()
            data = gpd.read_file(TMP_DIR + "\\" + x, encoding = "cp932")
            data.crs = from_epsg(epsg_num)
        else:
            tmp_data = gpd.read_file(TMP_DIR + "\\" + x, encoding = "cp932")
            tmp_data.crs = from_epsg(epsg_num)
            # データ結合
            data = pd.concat([data, tmp_data])

        cnt += 1

"""
shapefileを保存
"""
# Create a output path for the data
outfp = "temporary\\japan.shp"
data.to_file(outfp, encoding = "utf-8")
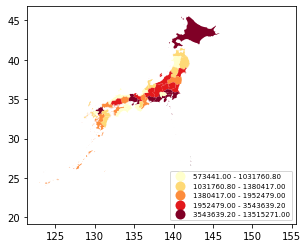
県で集約してからプロットする。
サンプル
data_ken = data[["PREF", "JINKO", "geometry"]].dissolve(by = "PREF", aggfunc = "sum") # 時間がかかるよ
data_ken.plot(column = 'JINKO', scheme = 'quantiles', cmap = 'YlOrRd', legend = True, legend_kwds={"loc": "lower right", "fontsize": 7})
結果はこんな感じ。

駅周辺人口などを集計して、bokehで表示
前にQGISのツールを使ってインタラクティブなwebページを作成したが、今回はbokehを使ってみた。
結果はこちら。
- 最初の関数設定はbokehでのプロット用。本当は検索窓などつけたかったが、それはまたいつか・・・
-
国勢調査2015の世帯データはe-statからダウンロード。
pandasのread_csvはzipのまま読み込めるので、県別にダウンロードしたzipをどこかのフォルダにまとめておいておき、展開と結合をすればOK。
ちなみに、各データの2行目は日本語の列名になっているが、不要なのでスキップする。
- 駅データについてははnetworkの節を参照。GeoDataFrameに変換。
-
境界データのshapefileに世帯データをKEY_CODEでjoin。
その前に、KEY_CODEでdissolveしておく。
同じKEY_CODEだが、境界データが複数存在する場合があるため(ちゃんと確認していないので間違っているかも)。
bufferを使って、半径xxの円を作成。areaを使って、境界データの各面積を計算。overlayを使って、境界データを1つ上で作成した円で切り取り、その各面積を計算。- 元の面積と切り取られた面積を利用して、人口などを計算する(各境界内に均等に人が住んでいるという仮定が入っている)。
- インタラクティブなマップの作成では、プロットの色付けを人口なのか世帯なのか、で変えたかったので
mapclassifyを使ってクラス分類をした。
サンプル
import pandas as pd
import numpy as np
import matplotlib.pyplot as plt
import geopandas as gpd
import mapclassify
from bokeh.plotting import figure, save
from bokeh.models import ColumnDataSource, LogColorMapper
from bokeh.palettes import RdYlBu11 as palette
from bokeh.models import Circle
from bokeh.layouts import Column, Row
from bokeh.models.widgets import TableColumn, DataTable
from fiona.crs import from_epsg
from shapely.geometry import Point, Polygon, LineString, MultiLineString


"""
関数設定
"""
# インタラクティブマップの作成関数 - 選択
def bokeh_plot_select(data, data_line, palette, set_bins = "jinko"):

    # 並べ変え
    data = data.sort_values("bins_" + set_bins)
    data["bins"] = data["bins_" + set_bins]
    #data["value"] = data["anbun_" + set_bins]

    # テーブルの列選択
    select_columns = ["station_name", "line_name", "anbun_jinko", "anbun_setai",
                      "anbun_setai1", "anbun_setai2", "anbun_setai3", "anbun_setai4",
                      "anbun_setai5"]

    select_columns_name = ["駅名", "路線", "人口", "世帯", "世帯1人",
                           "世帯2人", "世帯3人", "世帯4人", "世帯5人"]

    # ラインデータ
    g_data_line = ColumnDataSource(data_line.drop("geometry", axis = 1))
    # ポイントデータ
    g_data = ColumnDataSource(data.drop("geometry", axis = 1))
    # テーブル
    tc = [TableColumn(field = c1, title = c2) for c1, c2 in zip(select_columns, select_columns_name)]
    tbl_data = DataTable(source = g_data, columns = tc, width = 700, height = 150, fit_columns=True)

    # Create the color mapper
    color_mapper = LogColorMapper(palette=palette)

    # tooltips設定
    TOOLTIPS = [
        ("station_name", "@station_name"),
        ("line_name", "@line_name"),
        #("value", "@value")
        ("jinko", "@anbun_jinko"),
        ("setai", "@anbun_setai"),
        ("setai1", "@anbun_setai1"),
        ("setai2", "@anbun_setai2"),
        ("setai3", "@anbun_setai3"),
        ("setai4", "@anbun_setai4"),
        ("setai5", "@anbun_setai5")
        ]

    # Initialize our figure
    p = figure(title="test", plot_width = 700, plot_height = 700, tooltips = TOOLTIPS,
               tools = "pan,tap,box_zoom,box_select,reset,undo,save")

    # Add lines
    p.multi_line("x", "y", source = g_data_line, color="grey", line_width=0.5)

    # Add points on top (as black points)
    #p.circle('x', 'y', size=3, source=psource, color="black")
    r = p.circle("x", "y", size = 8, source = g_data, legend_field = "bins", line_color = "black", fill_color = {"field": "bins", "transform": color_mapper}, alpha = 0.6)

    r.selection_glyph = Circle(fill_color = "red", line_color = "black")
    r.nonselection_glyph = Circle(fill_alpha = 0.05, line_alpha = 0.05, fill_color = {"field": "bins", "transform": color_mapper})

    p.legend.location = "top_left"

    # 散布図
    p2 = figure(title = "scatter, x:setai1 - y:setai2", plot_width = 500, plot_height = 500,
                tools = "pan,tap,box_zoom,box_select,reset,undo,save")
    p2.line("anbun_setai1", "anbun_setai1", source = g_data, color = "yellow")
    r2 = p2.circle("anbun_setai1", "anbun_setai2", source = g_data, size = 9, fill_color = "blue")
    r2.selection_glyph = Circle(fill_color = "red")
    r2.nonselection_glyph = Circle(fill_alpha = 0.05, line_alpha = 0.05, fill_color = "blue")

    # Save the figure
    outfp = "tmp_map\\test_map.html"
    save(Row(Column(p, tbl_data), p2), outfp)

"""
2015国勢調査(世帯)データの読込(各県のデータは結合済み)
"""
df_setai = pd.read_csv("data\\setai2015.csv",
                       usecols = ["KEY_CODE", "T000850001", "T000850002", "T000850003", "T000850004", "T000850005", "T000850006", "T000850007", "T000850008"],
                       dtype = {"KEY_CODE" : object, "T000850001" : np.int64, "T000850002" : np.int64,
                                "T000850003" : np.int64, "T000850004" : np.int64, "T000850005" : np.int64,
                                "T000850006" : np.int64, "T000850007" : object, "T000850008" : object})


"""
駅データの読込
"""
df_edges = pd.read_csv("data\\join20200619.csv", dtype="object")[["station_cd1", "station_cd2"]]
df_vertex_name = pd.read_csv("data\\station20200619free.csv", dtype="object")[["station_cd", "station_g_cd", "station_name", "line_cd", "pref_cd" , "lon", "lat"]]
df_line_name = pd.read_csv("data\\line20200619free.csv", dtype="object")[["line_cd", "line_name"]]

# 無料版の場合、station_cdが6桁は使えない(新幹線)
df_edges = df_edges[(df_edges["station_cd1"].astype(int) >= 1000000) & (df_edges["station_cd2"].astype(int) >= 1000000)]

# station_g_cdに置き換える(df_edgesはそのままだと同じ駅でも違うコードが振られているので、同じ駅は1つのコードにしたい)
df_edges = df_edges.merge(df_vertex_name, left_on = "station_cd1", right_on = "station_cd", how = "left").drop(columns = ["station_cd", "station_name", "line_cd", "lon", "lat"])
df_edges = df_edges.rename(columns = {"station_g_cd" : "station_g_cd1"})
df_edges = df_edges.merge(df_vertex_name, left_on = "station_cd2", right_on = "station_cd", how = "left").drop(columns = ["station_cd", "station_name", "line_cd", "lon", "lat"])
df_edges = df_edges.rename(columns = {"station_g_cd" : "station_g_cd2"})
df_edges = df_edges.dropna()

# station_g_cdを使って駅名マスタを作り直す
df_vertex_name_fix = df_vertex_name.groupby("station_g_cd", as_index = False).first()
df_vertex_name_fix = df_vertex_name_fix.merge(df_line_name, on = "line_cd", how = "left")

# 路線データ
df_line = df_edges[["station_g_cd1", "station_g_cd2"]].merge(df_vertex_name_fix, left_on = "station_g_cd1", right_on = "station_g_cd", how = "left").drop(columns = ["station_g_cd", "station_cd", "station_name", "line_cd"])
df_line = df_line.rename(columns={"lon":"lon1", "lat":"lat1"})
df_line = df_line.merge(df_vertex_name_fix, left_on = "station_g_cd2", right_on = "station_g_cd", how = "left").drop(columns = ["station_g_cd", "station_cd", "station_name", "line_cd"])
df_line = df_line.rename(columns={"lon":"lon2", "lat":"lat2"})
## 型変換
df_line["lon1"] = df_line["lon1"].astype(str).astype(float)
df_line["lat1"] = df_line["lat1"].astype(str).astype(float)
df_line["lon2"] = df_line["lon2"].astype(str).astype(float)
df_line["lat2"] = df_line["lat2"].astype(str).astype(float)


"""
駅データ(ポイントデータ)をgeopandasでgeodataframeに変換
"""
# 全国
df = df_vertex_name_fix.copy()
gdf = gpd.GeoDataFrame(df, geometry = gpd.points_from_xy(df["lon"].astype(str).astype(float), df["lat"].astype(str).astype(float)))
# crsの設定
gdf.crs = from_epsg(4612)
print(gdf.crs)


"""
駅データ(ラインデータ)をgeopandasでgeodataframeに変換
"""
shp_line = [LineString([(df_line.loc[i, "lon1"], df_line.loc[i, "lat1"]), (df_line.loc[i, "lon2"], df_line.loc[i, "lat2"])]) for i in range(len(df_line))]
gdf_line = gpd.GeoDataFrame(df_line, geometry = shp_line)
gdf_line.crs = from_epsg(4612)
print(gdf_line.crs)

"""
shapefileを読込
"""
# 全国
fp = "temporary\\japan.shp"
gdf_base_org = gpd.read_file(fp, encoding = "utf-8")

# KeyCodeでdissolve
gdf_base_org = gdf_base_org[["KEY_CODE", "PREF", "CITY", "JINKO", "SETAI", "X_CODE", "Y_CODE", "geometry"]].dissolve(by = "KEY_CODE", aggfunc = "sum") # 時間がかかるよ

# 世帯データ結合(元々intだったのにfloatとなるが問題ない)
gdf_base_org = gdf_base_org.merge(df_setai, on = "KEY_CODE", how = "left")

# key_codeの頭5桁を使って集約(小地域だと細かいため)
#gdf_base_org["key_code_city"] = gdf_base_org["KEY_CODE"].str[:5]
#gdf_base = gdf_base_org[["key_code_city", "JINKO", "geometry"]].dissolve(by = "key_code_city", aggfunc = "sum") # 時間かかるよ
# 集約しない
gdf_base = gdf_base_org.copy()


"""
駅データとベースをプロットしてみる
注意!全国の場合にプロットすると大変!せめて、市区町村などで集約してからにすること!
"""
#ax = gdf_base.plot(facecolor='gray')
#gdf.plot(ax=ax, color='red', markersize = 0.1)


"""
座標系変換
"""
gdf_org = gdf.copy()
gdf = gdf.to_crs(epsg = 6933)
gdf_base = gdf_base.to_crs(epsg = 6933)


"""
駅から半径1kmの円を作成
"""
gdf["geometry"] = gdf["geometry"].buffer(distance = 1000)


"""
重なっている部分を抽出
"""
# 元の市区町村での面積を計算しておく
gdf_base["area_base"] = gdf_base.area

# 重なっている部分の面積を計算
intersection = gpd.overlay(gdf, gdf_base, how='intersection')
intersection["area_intersection"] = intersection.area

# 面積按分で人口を計算(関数化した方がいいか)
intersection["anbun_jinko"] = intersection["JINKO"] * intersection["area_intersection"] / intersection["area_base"]

# 面積按分で世帯を計算
intersection["anbun_setai"] = intersection["T000850001"] * intersection["area_intersection"] / intersection["area_base"]
intersection["anbun_setai1"] = intersection["T000850002"] * intersection["area_intersection"] / intersection["area_base"]
intersection["anbun_setai2"] = intersection["T000850003"] * intersection["area_intersection"] / intersection["area_base"]
intersection["anbun_setai3"] = intersection["T000850004"] * intersection["area_intersection"] / intersection["area_base"]
intersection["anbun_setai4"] = intersection["T000850005"] * intersection["area_intersection"] / intersection["area_base"]
intersection["anbun_setai5"] = intersection["T000850006"] * intersection["area_intersection"] / intersection["area_base"]

# station_g_cd毎に集約
res_anbun = intersection.groupby(["station_g_cd"], as_index = False).sum(["anbun_jinko", "anbun_setai", "anbun_setai1", "anbun_setai2", "anbun_setai3", "anbun_setai4", "anbun_setai5"])

# 元の駅ポイントデータにジョイン
gdf_res = gdf.merge(res_anbun[["station_g_cd", "anbun_jinko", "anbun_setai", "anbun_setai1", "anbun_setai2", "anbun_setai3", "anbun_setai4", "anbun_setai5"]], on = "station_g_cd", how = "left")
gdf_org_res = gdf_org.merge(res_anbun[["station_g_cd", "anbun_jinko", "anbun_setai", "anbun_setai1", "anbun_setai2", "anbun_setai3", "anbun_setai4", "anbun_setai5"]], on = "station_g_cd", how = "left")


"""
プロットしてみる
"""
# 座標系をもとに戻す
gdf_res = gdf_res.to_crs(epsg = 4612)
gdf_base = gdf_base.to_crs(epsg = 4612)

#ax = gdf_base.plot(facecolor='gray')
#gdf_res.plot(ax = ax, column="anbun_jinko", scheme="Fisher_Jenks", k=9, cmap="RdYlBu", linewidth=0, legend=True, legend_kwds={"loc": "upper left", "fontsize": 8})

gdf_res.plot(column="anbun_jinko", scheme="quantiles", cmap="RdYlBu", linewidth=0, legend=True, legend_kwds={"loc": "upper left", "fontsize": 8})


"""
インタラクティブなマップを作成してみる
"""
# 色分けのためのクラス分類
class_res = mapclassify.Quantiles(gdf_res["anbun_jinko"], k = 11)
gdf_res["group_jinko"] = class_res.yb
gdf_res["bins_jinko"] = class_res.bins[gdf_res["group_jinko"]]

# 色分けのためのクラス分類(世帯) -- 関数化したほうがいい
class_res = mapclassify.Quantiles(gdf_res["anbun_setai"], k = 11)
gdf_res["group_setai"] = class_res.yb
gdf_res["bins_setai"] = class_res.bins[gdf_res["group_setai"]]

class_res = mapclassify.Quantiles(gdf_res["anbun_setai1"], k = 11)
gdf_res["group_setai1"] = class_res.yb
gdf_res["bins_setai1"] = class_res.bins[gdf_res["group_setai1"]]

class_res = mapclassify.Quantiles(gdf_res["anbun_setai2"], k = 11)
gdf_res["group_setai2"] = class_res.yb
gdf_res["bins_setai2"] = class_res.bins[gdf_res["group_setai2"]]

class_res = mapclassify.Quantiles(gdf_res["anbun_setai3"], k = 11)
gdf_res["group_setai3"] = class_res.yb
gdf_res["bins_setai3"] = class_res.bins[gdf_res["group_setai3"]]

class_res = mapclassify.Quantiles(gdf_res["anbun_setai4"], k = 11)
gdf_res["group_setai4"] = class_res.yb
gdf_res["bins_setai4"] = class_res.bins[gdf_res["group_setai4"]]

class_res = mapclassify.Quantiles(gdf_res["anbun_setai5"], k = 11)
gdf_res["group_setai5"] = class_res.yb
gdf_res["bins_setai5"] = class_res.bins[gdf_res["group_setai5"]]

# x, y列作成 - ポイント
gdf_res["x"] = gdf_res["lon"].astype(str).astype(float)
gdf_res["y"] = gdf_res["lat"].astype(str).astype(float)

# x, y列作成 - ライン
gdf_line["x"] = [[gdf_line.loc[i, "lon1"], gdf_line.loc[i, "lon2"]] for i in range(len(gdf_line))]
gdf_line["y"] = [[gdf_line.loc[i, "lat1"], gdf_line.loc[i, "lat2"]] for i in range(len(gdf_line))]

# インタラクティブマップ作成
bokeh_plot_select(gdf_res, gdf_line, palette, "jinko") # jinko, setai, setai1, ...
結果はこちらからみることができる。
色は、人口をmapclassify.Quantilesで11個に分類。凡例の数値は分類範囲の最大値となっている。
円(駅のこと)にカーソルを合わせると詳細がポップアップで表示される。
円をクリックした場合は、赤色になり、他のテーブルやグラフもクリックした駅がハイライトされる。
一応、いくつかの駅について、jSTAT
MAPを使って、半径1kmの円の人口や世帯数を按分集計した結果と比較してみた。
値は大きくずれていないよう(値が1000ずれるとかはなさそう)なのでとりあえず良しとしよう・・・。


